October’s Assessment
Tampa Bay is emerging from a period of elevated inventory and lower demand, working toward normalization and a healthier balance between buyers and sellers. The sharp rise in financing costs makes that recovery less certain and may extend its timeline. Household finances remain generally healthy, and substantial real estate equity supports purchasing capacity, particularly among affluent owners. Although affordability remains difficult across the broader market, many top-end households can still make luxury purchases. They are being selective about deploying capital, favoring compelling locations, distinctive homes and pricing that makes sense today.
October Market Snapshot
$1.9M luxury median versus $2.0M in September; $641/sq. ft. versus $642; 88 days median marketing time. SBH’s Luxury Affordability Index declined to 0.92 from 0.94. The median shift may reflect sales mix rather than equivalent declines in individual home values.
MACRO & PURCHASING POWER
Wealth supports demand. Rates restrain action.
Strong balance sheets do not automatically translate into a decision to move.
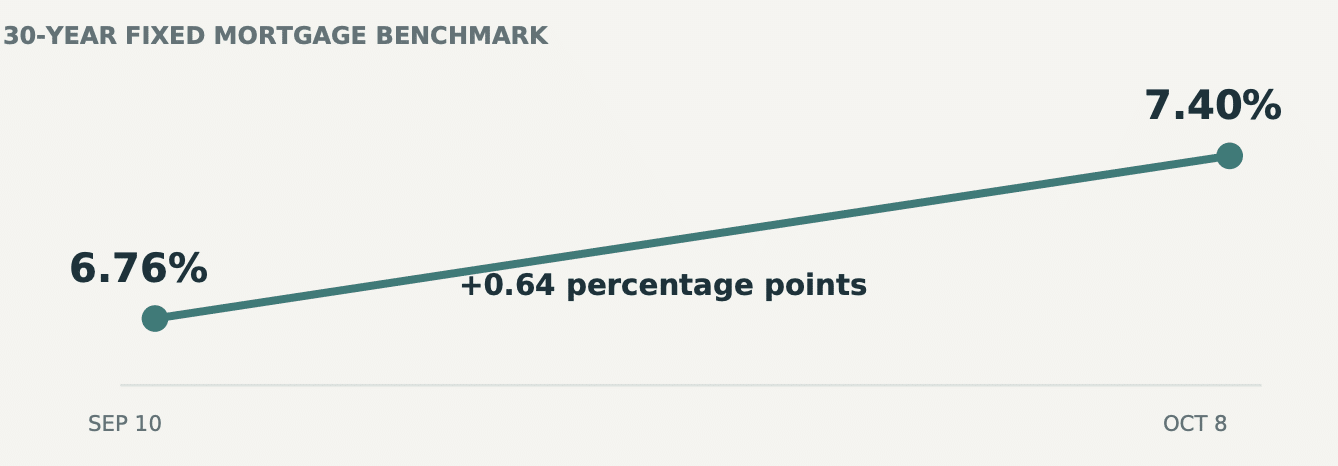
$3M purchase, 50% financed: a $1.5M, 30-year loan costs approximately $9,739/month at 6.76% versus $10,386 at 7.40%—about $647 more monthly. Illustration excludes taxes, insurance, fees and points; actual jumbo terms differ.
- Capacity remains substantial. Federal Reserve Q2 data put aggregate household net worth at $195.9 trillion. This supports the capacity narrative, but national wealth is not a measure of liquid cash available to a particular luxury buyer.
- The economy is vulnerable, not proven to be in recession. September payrolls rose 29,000 and unemployment was 4.2%. Slower hiring deserves attention; the data do not establish an imminent systemic crisis.
- Affluent buyers are not one group. Cash-rich households can absorb financing changes more easily. Buyers dependent on selling a home, borrowing or liquidating business/stock holdings face a higher decision hurdle.
SBH PROPRIETARY MARKET SNAPSHOT
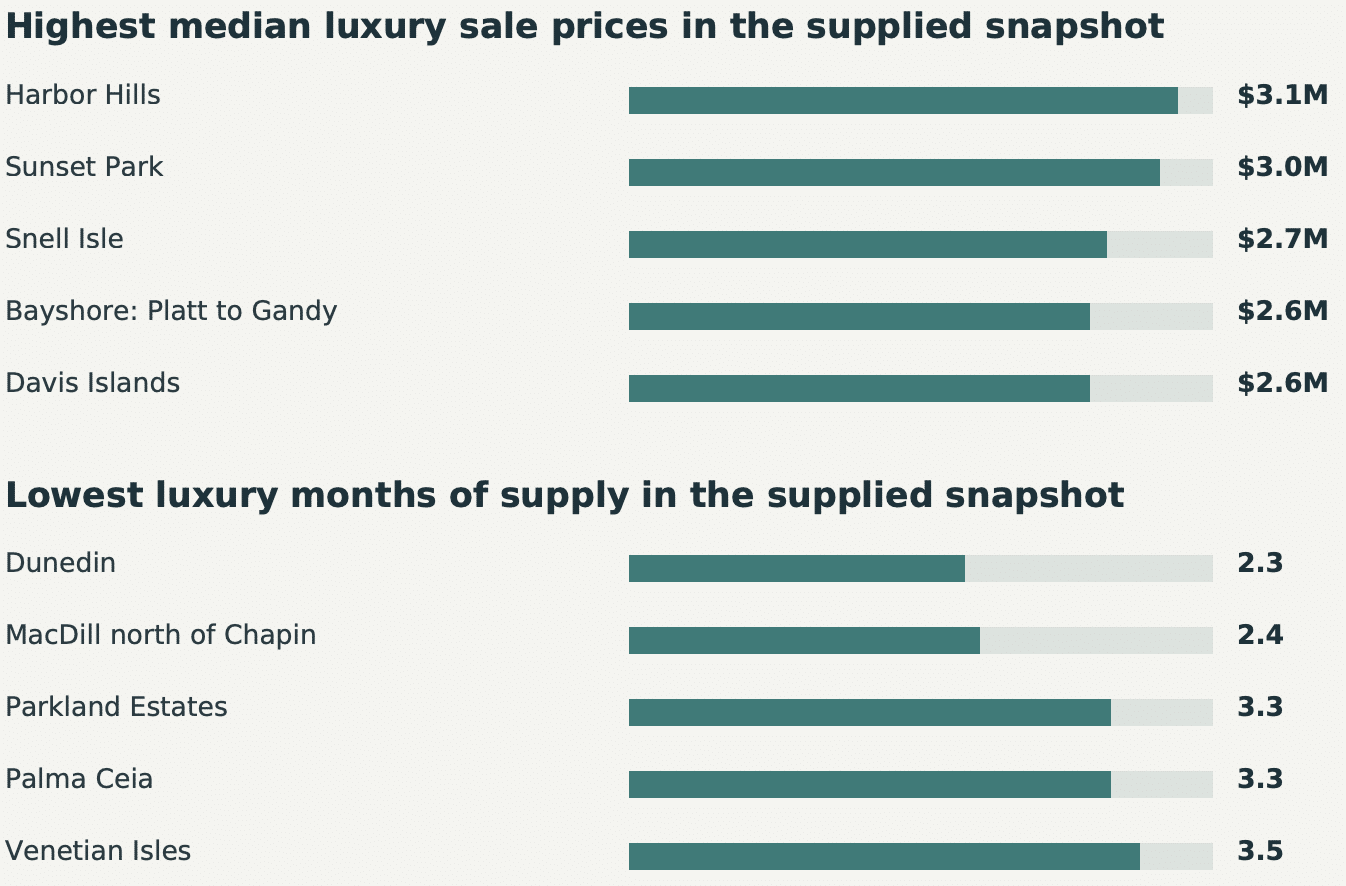
The neighborhood matters more than the headline.
October 2026 • Luxury transaction and supply measures
SUPPLY, LAND & THE SARASOTA COMPARISON
Today’s choice is not tomorrow’s pipeline.
Falling listings can coexist with negotiating room—and do not, by themselves, prove a shortage.
Separate available homes from future supply
- Current stock: what a buyer can choose now. Completed homes, homes under construction and active competing listings need to be absorbed. Long marketing periods can create negotiating opportunities even where the best properties remain scarce.
- Future flow: what can arrive later. Lots, permits and actual starts are different stages. A listed lot is not a funded project; a permit is not a start. A tighter 2028–2029 market requires sustained absorption and insufficient replacement—not simply fewer listings today.
Lots: pay for a buildable opportunity
Higher financing and carrying costs can reduce what a builder will pay for land before finished-home prices adjust. This can create custom-build opportunities, but a lower lot price may be offset by demolition, elevation, drainage, soils, trees, utilities or a constrained buildable envelope.
Acquisition principle: pay for scarcity and product distinction. Do not pay for generic land on the assumption that future appreciation will make an otherwise marginal build work.
Sarasota: encouraging, but not a straight-line recovery
August Sarasota County single-family inventory fell 20.8% year over year to 2,619; months of supply was 3.7. However, $1M+ sales fell 8.2% to 78, while the $2M–$2.99M band rose 18.2% to 13 sales. These mixed results support selective recovery rather than a broad luxury surge.
- South Tampa versus northeast St. Petersburg. The SBH snapshot shows scarce pockets in both areas. It does not establish which market will tighten first. Exact price-band competition and the next wave of comparable completions matter more than a citywide label.
BUY, UPGRADE OR COMMISSION
Choose the right path for your time horizon.
The strongest decision is one that works under today’s conditions.
Buying completed or near-complete new construction
- Best fit: certainty and near-term use. A finished home lets buyers inspect the actual light, proportions, workmanship and neighborhood setting. Compare the negotiated price with realistic alternatives, including the time and cost of a custom build.
- A premium can be justified—but should be explained. SBH’s October data indicate a meaningful new-construction premium to resale in the Core. The supplied snapshot does not quantify it or isolate age from location, size and quality.
Commissioning a custom home
- Best fit: a distinctive site and specific lifestyle needs. Customization offers control over layout and finishes. Budget land, site work, design, permits, construction, financing, temporary housing and contingency together; a lower land ask does not necessarily mean a cheaper finished home.
- Evaluate delivery as carefully as design. Confirm specifications, allowances, change-order procedures, financing, builder capacity and schedule assumptions. A favorable future market is a possible benefit, not a requirement for the decision to work.
Upgrading from an existing home
Evaluate the net cost of the move: the purchase price less realizable net sale proceeds, plus transaction costs, financing and ongoing ownership costs. A discount on the new home may be offset by a lower price on the home being sold. Obtain property-specific insurance and post-purchase tax estimates.
Buying now is more defensible when: the home is hard to replicate, the all-in cost is comfortable at current rates, reserves remain substantial and the ownership horizon is long.
Waiting is more defensible when: the purchase needs a refinance to work, liquidity depends on an uncertain sale or business event, or the available homes do not justify their price.
PRICE OUTLOOK & DECISION TIMING
Recovery remains plausible. The timetable is conditional.
Our overall outlook remains positive: Tampa Bay luxury is progressing toward a healthier market, supported by household wealth and selective neighborhood strength. The path is likely to be slow and uneven. Higher borrowing costs, changes in confidence and occasional setbacks may delay improvement without necessarily reversing the broader normalization.
- Late 2026: adjustment continues. Higher rates can slow contracts before appearing in closed sales. Expect selective negotiation and longer decisions.
- 2027: a path toward healthier balance. Gradual recovery remains plausible if employment, wealth and credit hold up. Higher rates make its pace less reliable.
- 2028–2029: potential supply advantage. Choice could narrow if comparable starts stay subdued while buyers return, supporting pricing where replacement is genuinely limited.
What would change the outlook?
- Orderly disinflation: earlier improvement. Lower inflation and borrowing costs, without substantial job or wealth losses, could release delayed moves. More buyers may return before all sellers reprice.
- Higher rates for longer: slower, uneven improvement. Affluent cash buyers remain active, but financed trade-ups lag. Nominal prices may stabilize while inflation erodes their real value.
- Credit or equity shock: a delay, not immediate relief. An AI/business-wealth correction or tighter lending could reduce luxury commitments. Treasury yields might fall while mortgage spreads widen or approvals become harder.
Finding a New Equilibrium
The market appears to be finding its near-term balance at a lower transaction volume. Florida Realtors’ August Tampa Bay single-family figures show active listings down 9.5% and closed sales down 7.6% year over year. Fewer homes are available, but fewer buyers are completing purchases.
Census monthly permit data show 9,480 single-family units authorized in January–August 2026 versus 10,495 in the same period of 2022, a decline of approximately 9.7%. The 2026 total is only 0.7% below the comparable 2025 period. Metro permits include production housing, not just luxury infill.
Our luxury-market assessment remains slightly buyer-favorable, with pockets of strength: SBH pricing is stable near $641 per square foot, while Palma Ceia and Parkland Estates show 3.3 months of luxury supply and Venetian Isles 3.5 months. Well-located, distinctive homes can command firmer terms while the wider market normalizes.